Epidemics and Pandemics in Maps – The Case of COVID-19

  • Posted on: 29 June 2020
  • By: mocnik
Maps

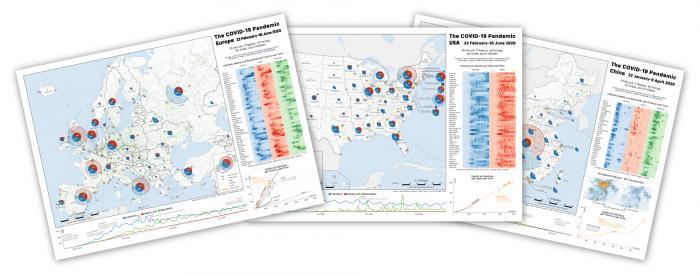
COVID-19 has a heavy impact on our lives, which is why information sharing is important. GIP discusses how to visualize pandemic data in our most recent article, written by FB Mocnik, P Raposo, W Feringa, MJ Kraak, and B Köbben:

https://doi.org/10.1080/17445647.2020.1776646

You are welcome to use the three COVID-19 maps published (China, Europe, and US). These are available as JPEG and PDF files as supplemental material under CC BY 4.0. ITC and the University of Twente care about society and wish you all good health.

“Epidemics and pandemics are geographical in nature and constitute spatial, temporal, and thematic phenomena across large ranges of scales: local infections with a global spread; short-term decisions by governments and institutions with long-term effects; and diverse effects of the disease on many aspects of our lives. Pandemics pose particular challenges to their visual representation by cartographic means. This article briefly summarizes some of these challenges and outlines ways to approach these. We discuss how to use the information usually available for telling the story of an epidemic, illustrated by the example of the 2019–2020 COVID-19 pandemic. The maps attached to this article demonstrate the discussed cartographic means.”

Word cloud controversy

Nice, thank you for this word cloud, Serkan! As a side note, you may be aware that - while often interesting and sometimes visually pleasing, like the one that you posted - word cloud interpretation is problematic, and word clouds are a controversial topic in the data visualization community.

Here are examples of negative usability results with word clouds:

1) https://www2007.org/posters/poster988.pdf

2) https://dl.acm.org/doi/pdf/10.1145/1240624.1240775

3) http://dl.ifip.org/db/conf/interact/interact2009-1/LohmannZT09.pdf

4) http://people.ischool.berkeley.edu/~hearst/papers/tagclouds.pdf

"Word clouds considered harmful", by The New York Times' senior software architect Jacob Harris: https://www.niemanlab.org/2011/10/word-clouds-considered-harmful/

Ways to improve word clouds: "Word Clouds: We Can’t Make Them Go Away, So Let’s Improve Them": https://www.ischool.berkeley.edu/news/2019/word-clouds-we-cant-make-them... - academic paper: https://ieeexplore.ieee.org/document/8665933

"Alternative Designs for Word Clouds and Some Research-Based Guidelines": https://medium.com/@FILWD/taking-word-clouds-apart-alternative-designs-f... - academic paper: https://static1.squarespace.com/static/5502f56fe4b0aa4bfbdae0a8/t/599a54...

This is an interesting subject!

Tags: 

GIP 2000 - 2020

  • Posted on: 5 June 2020
  • By: girgin

World clouds are quite powerful to summarize information. The size of a word shows its frequency, e.g. how often it appears in a text. This time it is the frequency in the titles of the GIP publications between 2000 and 2020! The image is based on the data available at the UT Research Information System, filtered by publication language (English), research unit (ITC), and keyword (GIP). It covers over 500 publications.

Pages