Temporal data analysis

Objective:
To design a method to execute a temporal data analysis to be able to selecte appropriate symbology to visualize change
Keywords:
Description:
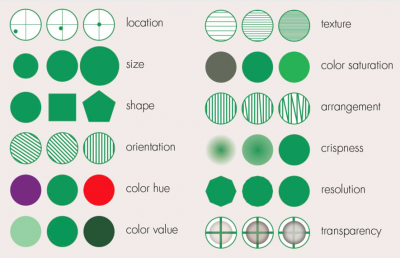
Before one can can map data one has to know its characteristics. For instance, do we deal with qualitative or quantitative data. This will decide on the perceptual properties of the symbols that should be used to allow the map to tell the story of the data.
What about temporal data, about data that represents change. Can we follow the typical attribute data analysis approach cartographers use or is a special approach required?
References:
Bertin, J. (1967/1982) Semiology of Graphics: Diagrams, Networks, Maps. Redlands: ESRI Press (2010 reprint).
Kraak, M.J. (2014) Mapping Time. Redlands: ESRI Press