Effectiveness of 2D and 3D symbols on virtual globes
Objective:
Keywords:
Description:
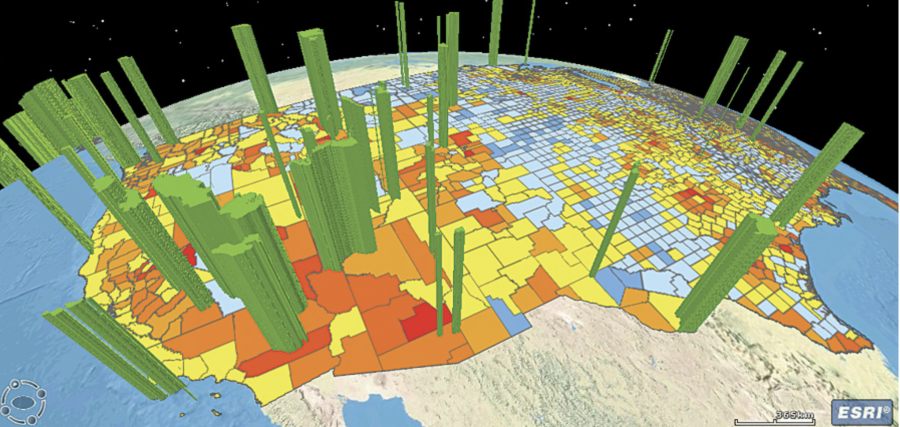
3D globes are a popular visualization type. They are also frequently used for thematic maps. Nevertheless, cartographers lack of validated guidelines on how to design such maps and in particular their symbology.
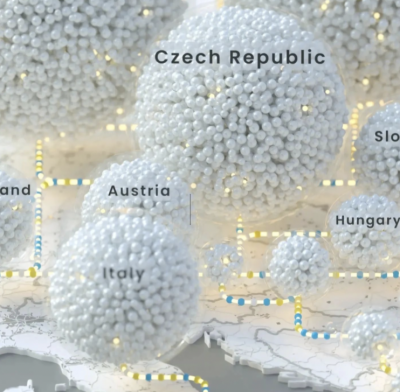
A thesis in this topic could expand on the study of Satriadi et al. (2021), and test other graphic primitives like spheres (or sphere in spheres), diamonds / boxes, arrows, etc. Possible questions could be: How does the effectiveness vary between static 3d visualizations (3d rendered image) and interactive visualizations?
How effective is the Geoburst visualization type (in an static and interactive environment) compared to conventional 3D globes?
Are the other/better(?) ways of using 3D maps in combination with 2D symbols or linking?
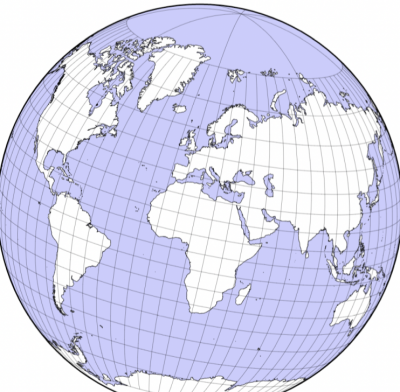
This topic could also consider the use of the gilbert-to-world projection, as an alternative to the idea of complementary globes.
References:
Satriadi, Kadek Ananta, Barrett Ens, Tobias Czauderna, Maxime Cordeil, and Bernhard Jenny. “Quantitative Data Visualisation on Virtual Globes.” In Proceedings of the 2021 CHI Conference on Human Factors in Computing Systems, 1–14. CHI ’21. New York, NY, USA: Association for Computing Machinery, 2021. https://doi.org/10.1145/3411764.3445152.
Satriadi, Kadek Ananta, Jim Smiley, Barrett Ens, Maxime Cordeil, Tobias Czauderna, Benjamin Lee, Ying Yang, Tim Dwyer, and Bernhard Jenny. “Tangible Globes for Data Visualisation in Augmented Reality.” In CHI Conference on Human Factors in Computing Systems, 1–16. New Orleans LA USA: ACM, 2022. https://doi.org/10.1145/3491102.3517715.
White, Travis Maclean. “Evaluating the Effectiveness of Thematic Mapping on Virtual Globes.” Thesis, University of Kansas, 2012. https://kuscholarworks.ku.edu/handle/1808/18631.
Domain(s):
Study Program(s):
- MSc. Cartography (EXCLUSIVELY externally advertised)