Reproducing and updating historic user studies from cartography and related domains
Objective:
Description:
Note: this project can be picked by two students simultaneously for the summer term 2023.
In recent years, researchers in psychology and other fields have attempted to reproduce the findings of some well-known studies, only to find out that in many cases the effects claimed by the original study could not be observed when the experiment was repeated. This failure to verify supposedly well-established knowledge was dubbed the replication crisis (Kosara & Haroz, 2018). Besides casting doubt on the original studies and the claimed results, this crisis shows that research is never “completed”, but requires continuous effort to verify and update findings in the context of societal changes and continuously developing research methods and tools.
Even if we do not doubt their results, many publications on historical studies have been found lacking essential information needed to replicate the experiment, which often has to be deduced from brief and potentially incomplete descriptions or graphical figures by researchers trying to recreate a study. The goal of this research project is to re-implement some classical user studies from cartography and related fields using a modern implementation framework, in order to make available the implementation as open source code, and to attempt to replicate the findings of the original studies in a modernized context (changed demographics, possibly changed display medium etc.). Furthermore, in addition to a replication as true to the original as feasible, the original study designs can be extended by additional aspects and parameters in order to broaden the generated insight besides the narrow replication effort – such as comparing desktop and mobile viewing scenarios, differentiation by age or other demographic factors, usage contexts, stress levels etc.
Candidates are invited to make their own proposal for which studies to replicate. In the scope of a single thesis project, a set of at least two related studies should be implemented and conducted (depending on the extent and complexity of the replication effort). Some examples for studies to consider would be:
(in alphabetical order; all papers are available from the supervisor upon request)
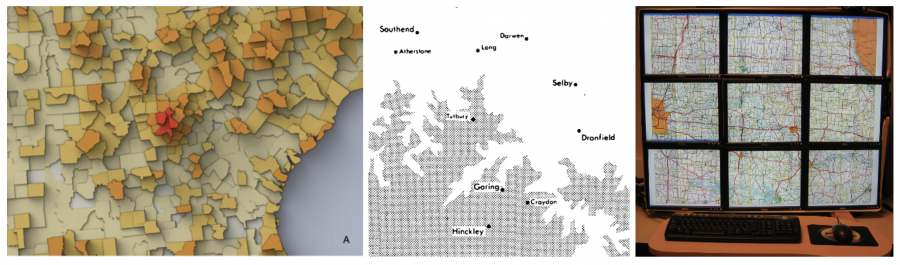
- Choengsa-ard et al’s study on multivariate symbols (Choengsa-ard et al., 2013)
- Crawford’s study on the perception of grey-tone symbols (Crawford, 1971)
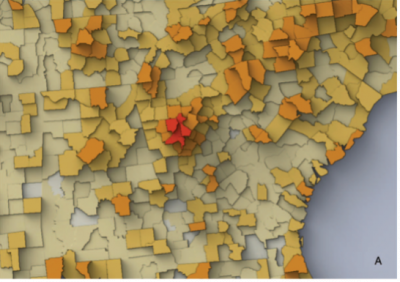
- Fish et al’s study on animated choropleth maps (Fish et al., 2011)
- Flannery’s study on the perception of graduated (scaled) circles (Flannery, 1956, 1971)
- Griffin et al’s comparison between animated maps and small-multiples for identifying clusters (Griffin et al., 2006)
- Harrower’s comparison of classed and unclassed animated choropleth maps (Harrower, 2007)
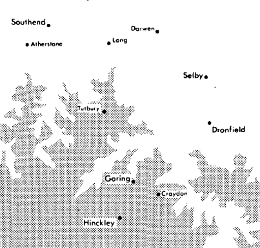
- Korpi et al’s study on the legibility of partially occluded map symbols (Korpi et al., 2013)
- Lloyd and Bunch’s study on gender effects on map reading performance (Lloyd & Bunch, 2008)
- Luebbering et al’s studies on map reading on multi-monitor displays (Luebbering et al., 2008) and digitizing tasks on varying display size (Luebbering & Carstensen, 2009)
- Miller’s report on the information processing capability of humans (Miller, 1956)
- Shortridge’s study on lettering size (Shortridge, 1979)
- Stewart and Kennelly’s study on shaded choropleth maps (Stewart & Kennelly, 2010)
(proposals by the student for potential candidate papers to replicate are very welcome!)
Required knowledge and skills
The studies should be implemented using stimsrv (Ledermann, 2021; Ledermann & Gartner, 2021), a JavaScript framework for conducting user studies developed at the cartography group at TU Wien. A basic familiarity with JavaScript and web technologies (HTML, CSS, SVG) and a willingness to learn is therefore required for this project. An introduction to the stimsrv framework will be provided to candidates at the start of the project.
Staff working in this domain: Florian Ledermann (TU Wien)
References:
- Choengsa-ard, V., Tripathi, N. K., & Janecek, P. (2013). Effective Graphic Features for Multivariate Symbol Mapping. The Cartographic Journal, 50(1), 66–81.
- Crawford, P. V. (1971). Perception of Grey-Tone Symbols. Annals of the Association of American Geographers, 61(4), 721–735. https://doi.org/10.1111/j.1467-8306.1971.tb00821.x
- Fish, C., Goldsberry, K. P., & Battersby, S. (2011). Change blindness in animated choropleth maps: An empirical study. Cartography and Geographic Information Science, 38(4), 350–362.
- Flannery, J. J. (1956). The graduated circle: A description, analysis, and evaluation of a quantitative map symbol.
- Flannery, J. J. (1971). The relative effectiveness of some common graduated point symbols in the presentation of quantitative data. Cartographica: The International Journal for Geographic Information and Geovisualization, 8(2), 96–109.
- Griffin, A. L., MacEachren, A. M., Hardisty, F., Steiner, E., & Li, B. (2006). A comparison of animated maps with static small-multiple maps for visually identifying space-time clusters. Annals of the Association of American Geographers, 96(4), 740–753.
- Harrower, M. (2007). Unclassed animated choropleth maps. The Cartographic Journal, 44(4), 313–320.
- Korpi, J. A., Haybatollahi, M., & Ahonen-Rainio, P. (2013). Identification of partially occluded map symbols. Cartographic Perspectives, 76, 19–32.
- Kosara, R., & Haroz, S. (2018). Skipping the Replication Crisis in Visualization: Threats to Study Validity and How to Address Them. https://doi.org/10.31219/osf.io/f8qey
- Ledermann, F. (2021). Stimsrv GitHub repository. https://github.com/floledermann/stimsrv
- Ledermann, F., & Gartner, G. (2021). Towards Conducting Reproducible Distributed Experiments in the Geosciences. AGILE: GIScience Series, 2(33). https://doi.org/10.5194/agile-giss-2-33-2021
- Lloyd, R. E., & Bunch, R. L. (2008). Explaining map-reading performance efficiency: Gender, memory, and geographic information. Cartography and Geographic Information Science, 35(3), 171–202.
- Luebbering, C. R., & Carstensen, L. W. (2009). Varying Display Size and Resolution for Digitizing Vector and Raster Targets: A Study of Digitizing Performance on Multiple-Monitor High-Resolution Displays.
Domain(s):
Study Program(s):
- MSc. Cartography (EXCLUSIVELY externally advertised)