Creation of an automated workflow for the production of a printed map
Objective:
Keywords:
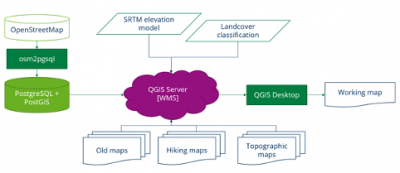
 Visualization of the current workflow of the map production
Description:
A new Alpine Club map for the region around the peak Ushba in Georgia should be produced. Mt. Ushba is situated in the Caucasus that forms the border between Georgia and Russia. On the Georgian side, the historical province of Svaneti is located, famous for its spectacular mountains, botany, and tower houses, which are part of the UNESCO World Heritage Sites. In addition, Svaneti is a popular touristic destination in winter and summertime. In cooperation with the German Alpine Club, the Institute of Cartography of the Dresden University of Technology decided to create a new large-scale Alpine Club map for this area. Target is a high-quality map for various mountain activities in the Alpine Club tradition, along with sustainable data storage, multi-source evaluation, and reuse of geo-information of existing topographic references and OpenStreetMap. A further important information source will be remote sensing imagery provided by Planet Labs Inc. As a result of our field campaign, many newly captured and updated data will be made available in return in OpenStreetMap.
For creating the map, it is necessary to combine all the mentioned data and generalize it to the final map scale. Through the circumstance that some data sources, especially OpenStreetMap, experience updates, the workflow should be repeatable and automatized as possible. Several tools are involved in this process and need to be stacked together. The current solution should be evaluated and improved to embed more generalization tools. Finally, have the visualization to be done. There are several restains as color space and profile, resolution, which can play a role in the final layout process besides visualization functions. A suitable software or software bundle should be chosen to create a print-ready map as a PDF.
Staff involved:
Mathias Gröbe
Dirk Burghardt
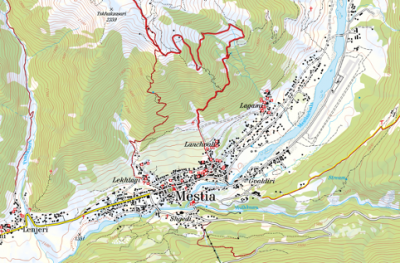
 Current working map produced with QGIS
References:
Kunz, Peter, und Joachim Bobrich. „Multiscale Cartographic Visualization of Harmonized Datasets“. International Journal of Cartography 5, Nr. 2–3 (4. Mai 2019): 178–94. https://doi.org/10.1080/23729333.2019.1610931.
Onyshchenko, Mariia, Vitalii Ostroukh, Viktoriia Lepetiuk, und Iryna Pidlisetska. „Creation of Tourist Maps Series as a Type of Regional System Tourism Mapping“. The Cartographic Journal, 17. August 2021, 1–14. https://doi.org/10.1080/00087041.2021.1937827.
Domain(s):
Study Program(s):
- MSc. Cartography (EXCLUSIVELY externally advertised)
