Corona plain figures
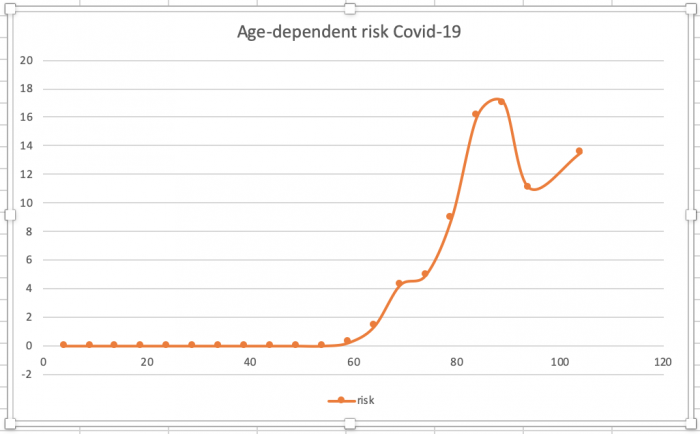
I needed a break and do something "fun." RIVM publishes daily data overviews of situation in the Netherlands. I just looked at the data per age group, size five years: 0-4, 5-9 etc.
From the number of registered cases and the number of diseased, you can infer a proxy for fatality risk. See illustration tht gives a percentage.
Hope you are somewhere at a good point on that curve. Me, unless the crisis lasts for 5 years or more, am not yet at risk.
Incidentally, RIVM states that many cases are no longer reported; there simply are not enough tests for that.